A bit about the project

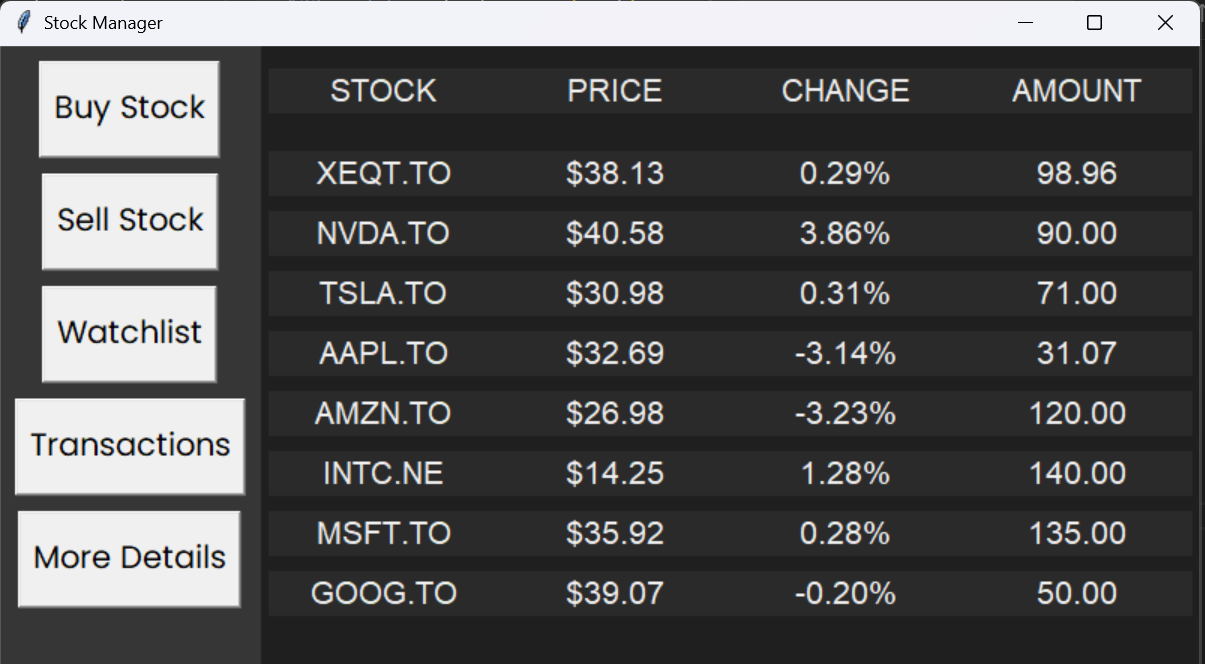
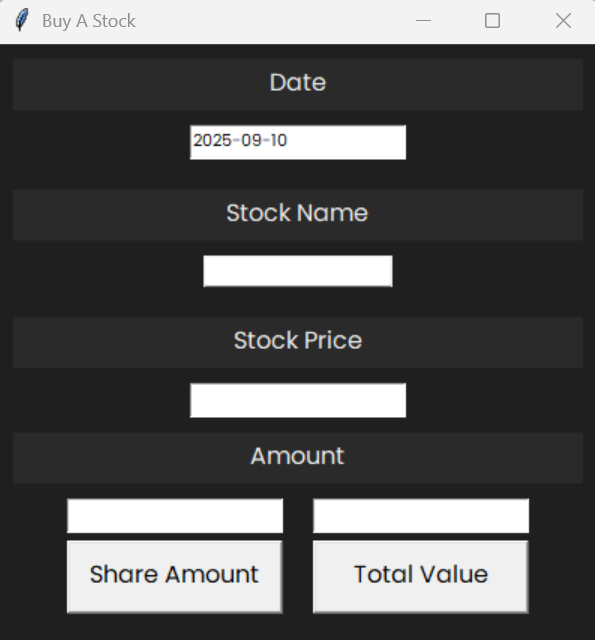
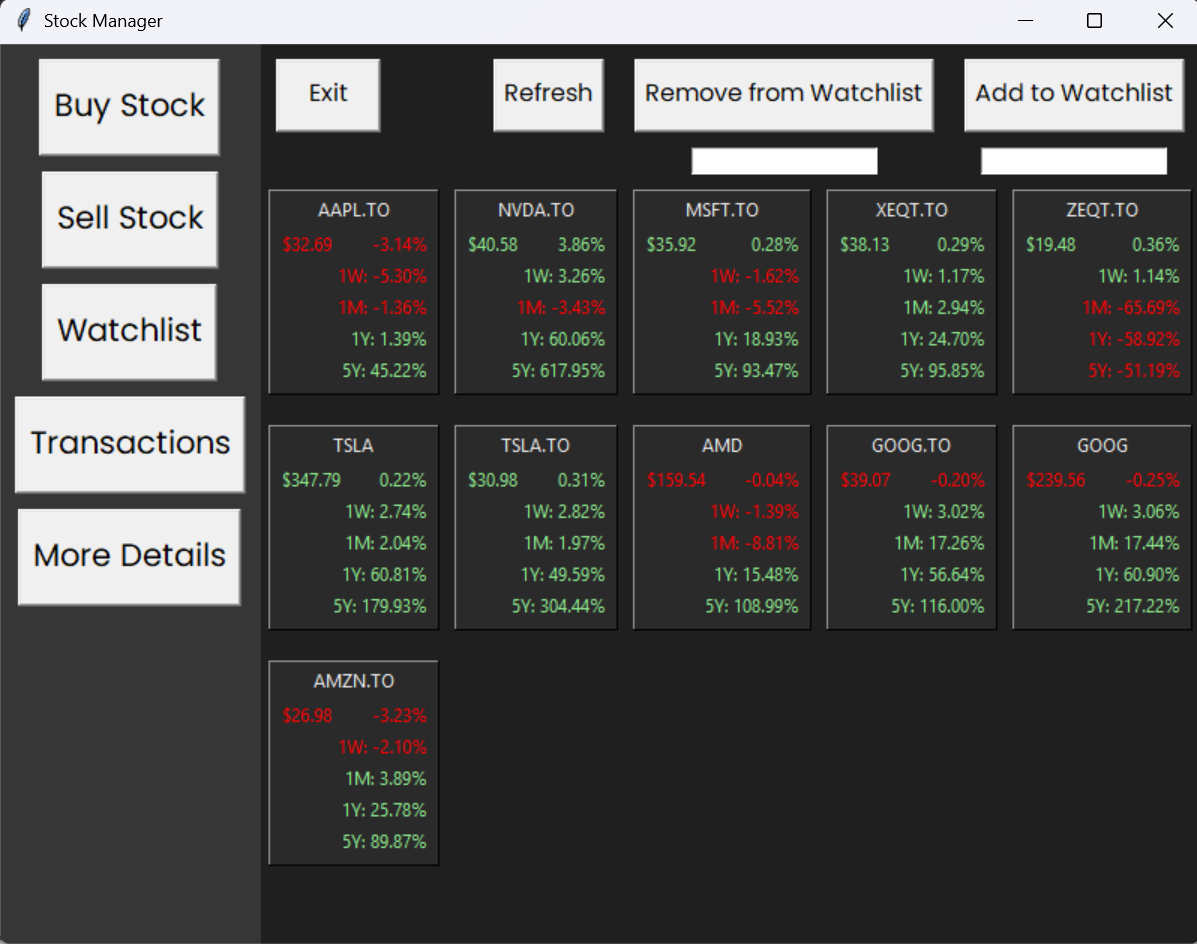
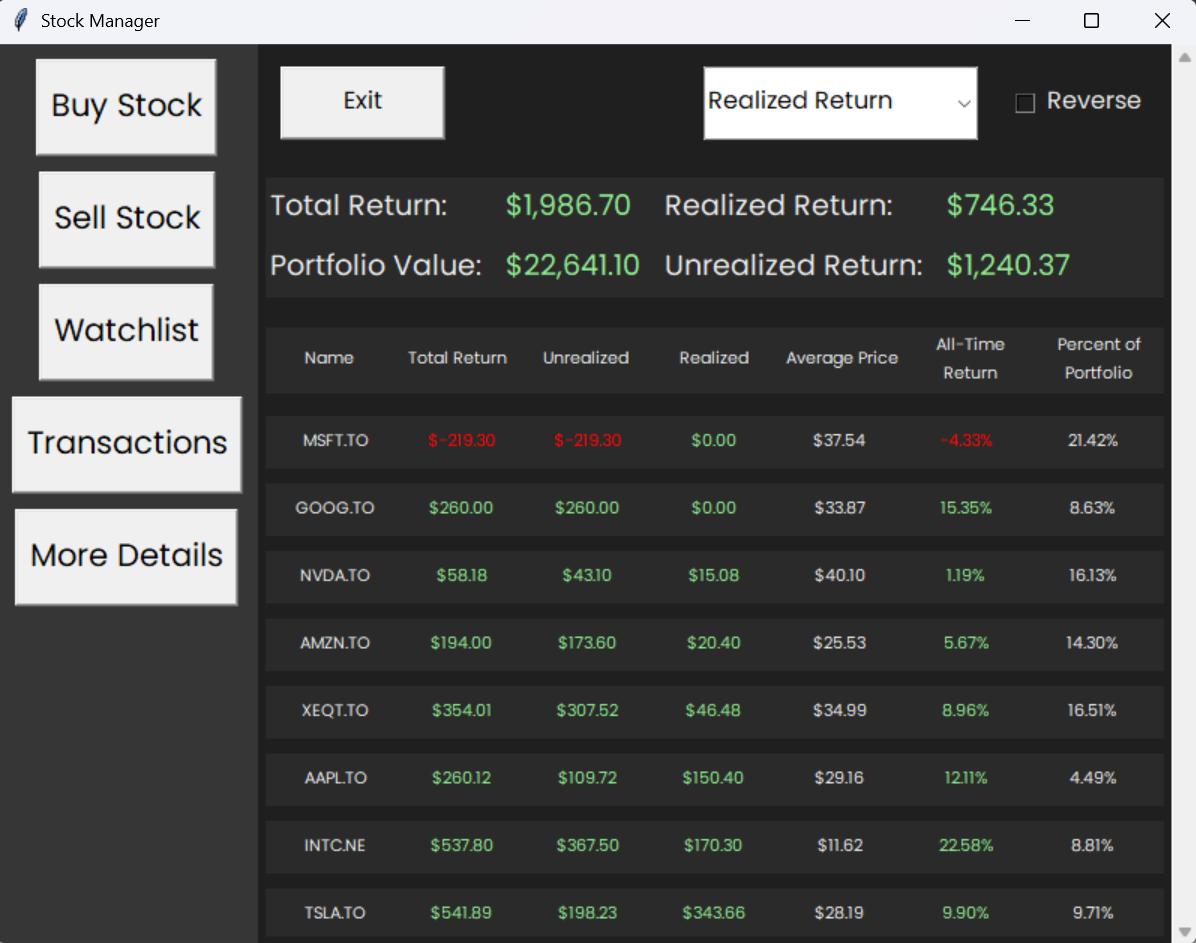
This stock portfolio manager allows the user to buy and sell stocks and provides various information about the trades. It can be used to simulate trading on the stock market without spending real money, or as a way to keep track of all of the user's real transactions so that the user can access all the information about their portfolio. The entire project was done in Python, using Tkinter for the graphics, yfinance for the stock information, and pandas/openpyxl for reading and writing to the excel sheet where the information is stored.

Buying Interface

This is the interface for buying and selling a stock. It asks the user the price they purchased the stock at and how many shares or the value of the total purchase. The purchase price is left up to the user so that real world trades made at a different time can be recorded as they were made rather than be restricted to whatever the current stock price is.

Watchlist

The watchlist shows the percent change since last close, 1 week, 1 month, 1 year, and 5 years. The refresh button updates all the stock prices and their changes.

Transaction History

This is where past transactions can be viewed and edited if mistakes were made entering information. Transactions can also be deleted from here. Transactions are necessary to be tracked so that other information can be calculated such as average price, and realized return. The transactions can also be sorted by each attribute to make specific transactions easy to find.

Details

This is more information about all the securities ever traded. This allows the user to see how much progress they've made since they started trading and keep track of their best performing holdings. These can also be sorted by any of the attributes listed in the header.